Weaker Jobs Report Fuels Expectations for Federal Reserve Intervention, While Tech Giants Lead Earnings Surge
In a continuation of last week’s bullish trend, U.S. stocks surged on Monday, fueled by speculation of a potential interest rate cut by the Federal Reserve. The optimism stemmed from a weaker-than-expected U.S. jobs report released on Friday, which bolstered prospects for monetary policy intervention to stimulate economic growth.
Federal Reserve Chair Jerome Powell’s recent comments dismissing the possibility of an interest rate hike and affirming the adequacy of current monetary policy further buoyed market sentiment. Powell’s reassurance that inflation would eventually align with the central bank’s 2% target echoed positively among investors, particularly in light of Friday’s lackluster employment data.
Click Here To Subscribe To Our YouTube Channel, Don’t Miss Out!
Amidst this backdrop, the 10-year Treasury yield retreated to 4.473%, with the two-year yield at 4.787%, relinquishing gains accrued over the past month. The decline in yields reflects growing expectations of a rate cut by the Federal Reserve, with market participants anticipating potential monetary easing in the coming months.
Attention now shifts to corporate earnings, with prominent companies such as Walt Disney and Uber Technologies slated to report this week. Last week saw tech behemoths like Alphabet and Microsoft delivering robust earnings, underscoring the resilience of the technology sector amidst economic uncertainty. Amazon and Google, in particular, showcased impressive performances driven by strong growth in cloud computing and advertising revenue, respectively.
However, despite the positive earnings momentum, uncertainty persists regarding the trajectory of interest rates. The breach of key yield levels, notably 4.5% and 4.7% on the 10-year yield, has sparked speculation that there may not be further rate cuts this year. Investors are wary of the potential impact of a rise to 5% on equities, adding complexity to the market outlook and necessitating a cautious approach.
In addition to earnings reports, the latest employment data provides insights into the health of the labor market. April’s jobs report, though falling short of expectations, indicated resilience with the addition of 175,000 jobs. However, concerns linger over the slight uptick in the unemployment rate to 3.9% and sluggish wage growth, signaling ongoing challenges for workers. The downward revision of employment figures for previous months further underscores the uneven nature of the labor market recovery.
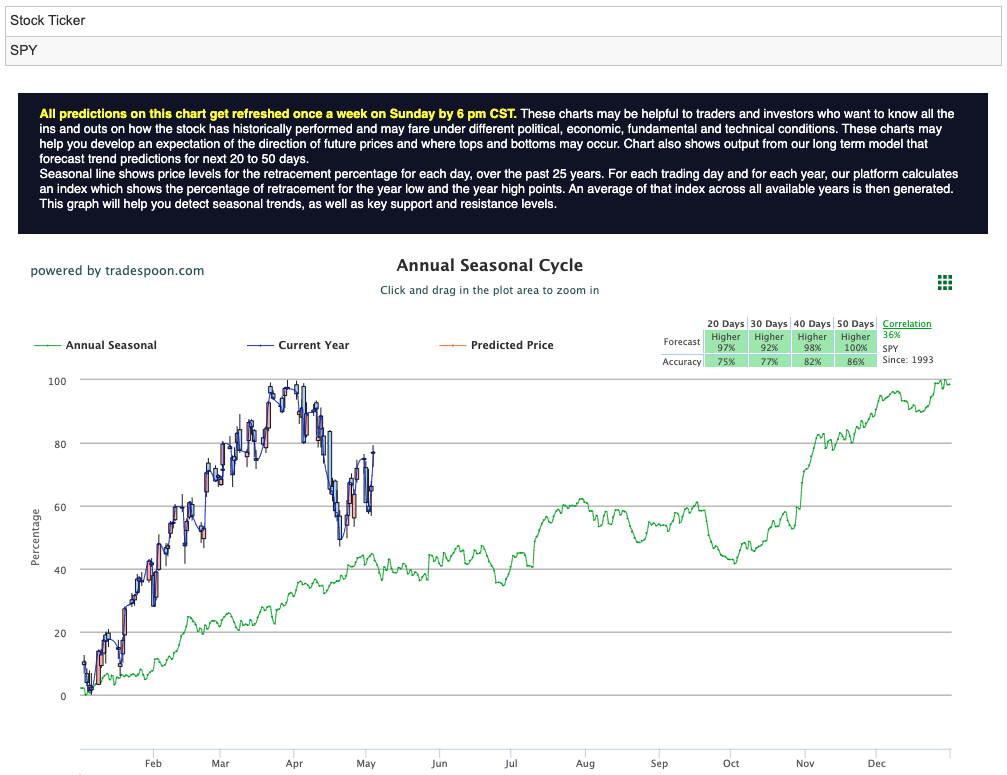
Against this backdrop, the outlook for the SPDR S&P 500 ETF (SPY) remains cautiously optimistic. While buoyed by strong earnings, technical indicators suggest potential downside risks ahead. Short-term support is anticipated within the $480 to $500 range, emphasizing the importance of vigilance and adaptability in navigating the market’s volatile trajectory. For reference, the SPY Seasonal Chart is shown below:
In conclusion, the convergence of earnings optimism and speculation surrounding interest rate cuts shapes the current landscape of U.S. stocks. While market participants remain hopeful for supportive monetary policy measures, ongoing economic uncertainties underscore the need for a prudent approach to investing in the ever-evolving financial markets.
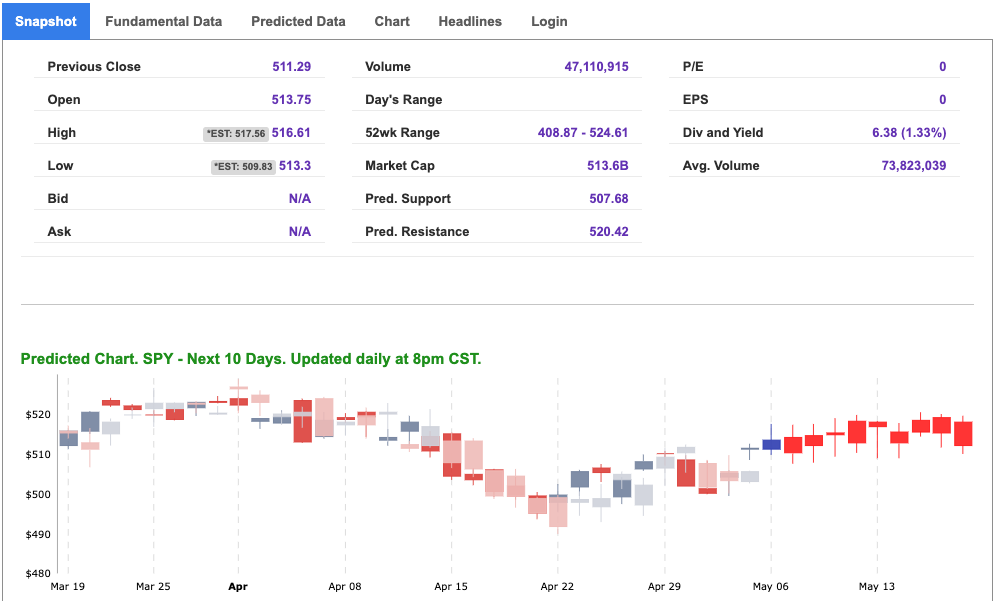
For reference, the S&P 10-Day Forecast is shown below:
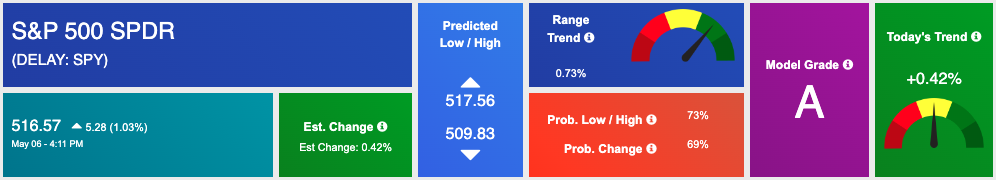
Using the “SPY” symbol to analyze the S&P 500 our 10-day prediction window shows a near-term positive outlook. Prediction data is uploaded after the market closes at 6 p.m. CST. Today’s data is based on market signals from the previous trading session.
NEW ROBOINVESTOR SPECIAL:
$100 OFF! Breakthrough, high-tech Artificial Intelligence platform available to Tradespoon’s individual investors:
Click Here – To See Where AI Places My Money
Tuesday Morning Featured Symbol
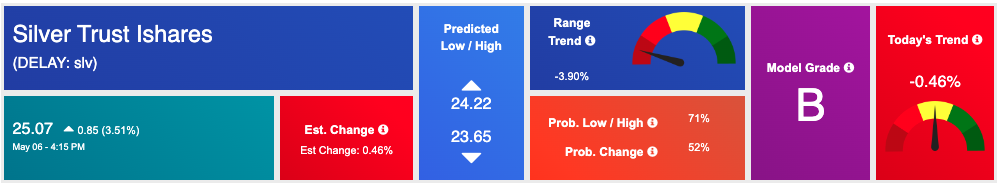
Our featured symbol for Tuesday is Silver Trust iShares (SLV). SLV is showing a steady vector in our Stock Forecast Toolbox’s 10-day forecast.
The symbol is trading at $25.07 with a vector of -0.46% at the time of publication.
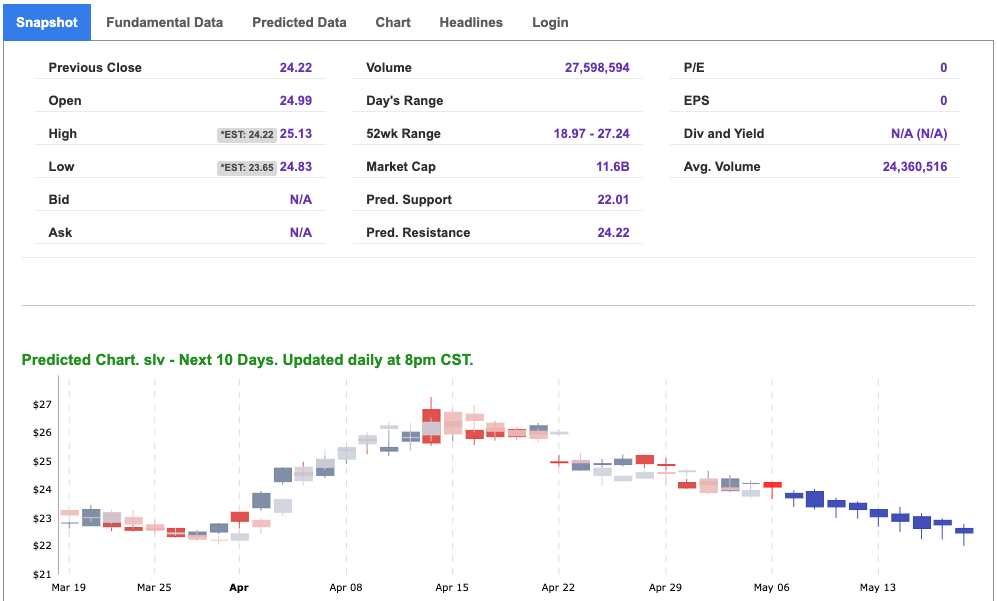
10-Day Prediction data is uploaded after the market close at 6 p.m., CST. Today’s data is based on market signals from the previous trading session.
Note: The Vector column calculates the change of the Forecasted Average Price for the next trading session relative to the average of actual prices for the last trading session. The column shows the expected average price movement “Up or Down”, in percent. Trend traders should trade along the predicted direction of the Vector. The higher the value of the Vector the higher its momentum.
*Please note: At the time of publication Vlad Karpel does have a position in the featured symbol, SLV. Our featured symbol is part of your free subscription service. It is not included in any paid Tradespoon subscription service. Vlad Karpel only trades his money in paid subscription services. If you are a paid subscriber, please review your Premium Member Picks, ActiveTrader, or MonthlyTrader recommendations. If you are interested in receiving Vlad’s picks, please click here.
Click Here To Subscribe To Our YouTube Channel So You Don’t Miss Out!
Oil
West Texas Intermediate for Crude Oil delivery (CL.1) is priced at $78.68 per barrel, up 0.73%, at the time of publication.
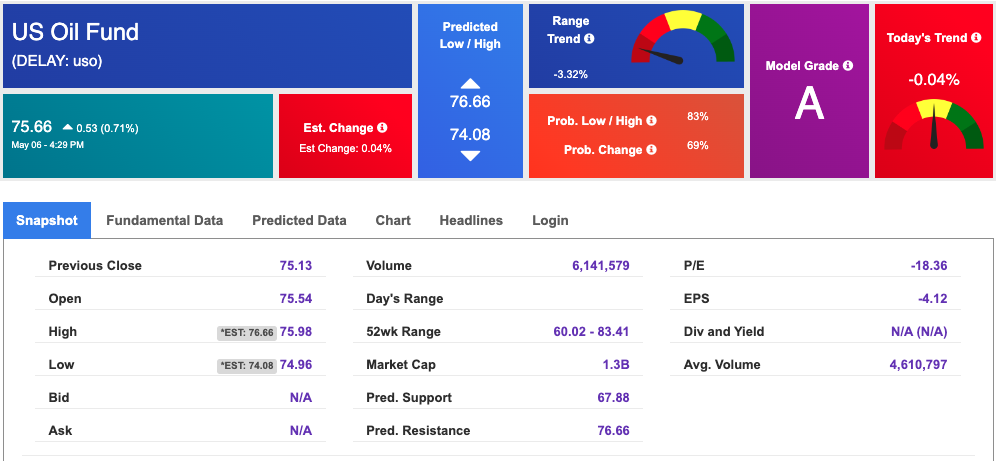
Looking at USO, a crude oil tracker, our 10-day prediction model shows mixed signals. The fund is trading at $75.66 at the time of publication. Prediction data is uploaded after the market close at 6 p.m., CST. Today’s data is based on market signals from the previous trading session.
Gold
The price for the Gold Continuous Contract (GC00) is up 1.05% at $2332.90 at the time of publication.
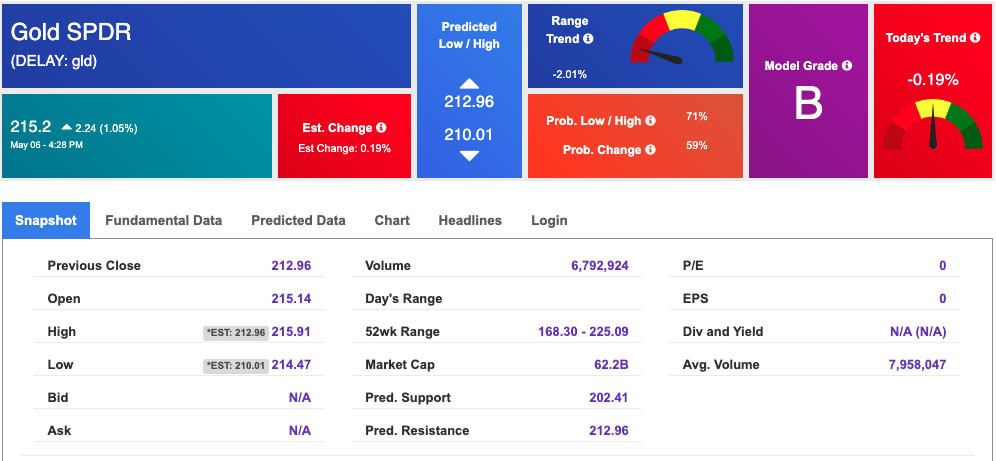
Using SPDR GOLD TRUST (GLD) as a tracker in our Stock Forecast Tool, the 10-day prediction window shows mixed signals. The gold proxy is trading at $215.2 at the time of publication. Vector signals show -0.19% for today. Prediction data is uploaded after the market close at 6 p.m., CST. Today’s data is based on market signals from the previous trading session.
Treasuries
The yield on the 10-year Treasury note is down at 4.490% at the time of publication.
The yield on the 30-year Treasury note is down at 4.638% at the time of publication.
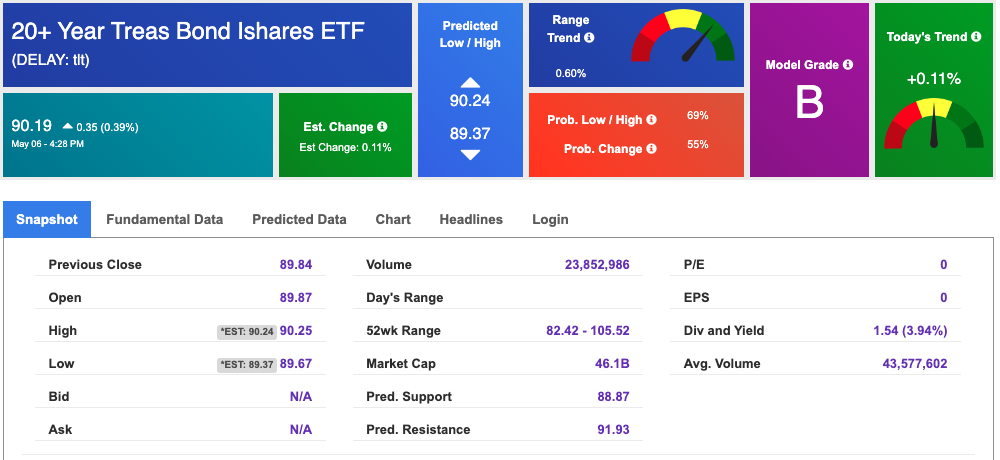
Using the iShares 20+ Year Treasury Bond ETF (TLT) as a proxy for bond prices in our Stock Forecast Tool, we see mixed signals in our 10-day prediction window. Prediction data is uploaded after the market close at 6 p.m., CST. Today’s data is based on market signals from the previous trading session.
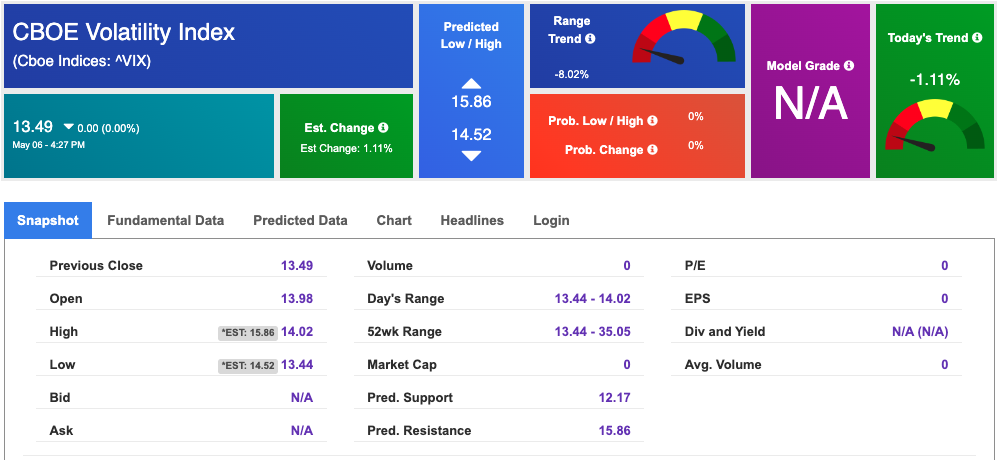
Volatility
The CBOE Volatility Index (^VIX) is priced at $13.49 down 0.00% at the time of publication, and our 10-day prediction window shows mixed signals. Prediction data is uploaded after the market close at 6 p.m., CST. Today’s data is based on market signals from the previous trading session.
NEW ROBOINVESTOR SPECIAL:
$100 OFF! Breakthrough, high-tech Artificial Intelligence platform available to Tradespoon’s individual investors:
Click Here – To See Where AI Places My Money
Original source: https://www.tradespoon.com/blog/wall-street-roars-stocks-soar-on-rate-cut-buzz/