As the new week kicks off, investors brace themselves for market turbulence with a keen eye on the latest inflation report due to be released on Tuesday. Last week’s soft market close has left analysts and traders speculating about the Federal Reserve’s potential response to mounting inflationary pressures.
The upcoming release of the consumer price index (CPI) for February has heightened anticipation, with expectations of a 3.1% year-over-year increase. This figure mirrors January’s unexpectedly high inflation rate, which triggered a significant downturn in stocks. The market remains on edge, awaiting cues on whether the Fed will pivot towards interest rate cuts to combat inflation.
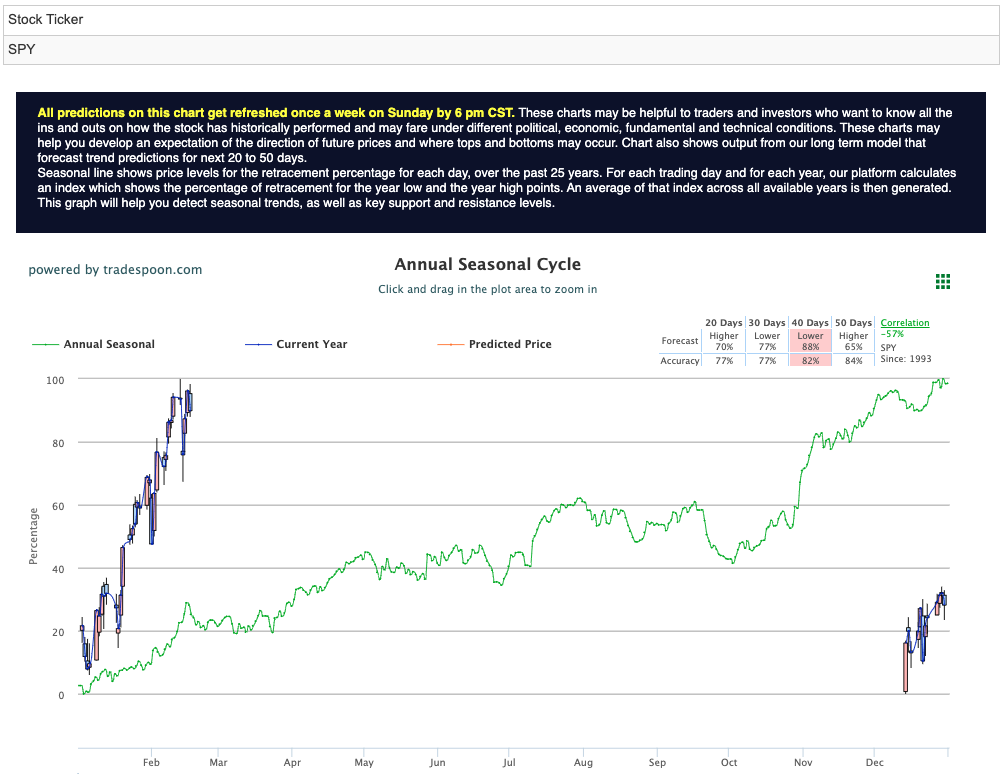
Last week witnessed intense scrutiny of key economic indicators, particularly the employment data and Federal Reserve commentary. While initial consensus suggested a pause in rate hikes for 2024 and the possibility of rate cuts in the near term, skepticism persisted, especially within the tech sector. Consequently, some investors adopted a cautious stance, wary of overbought conditions and the consolidation of mega-cap stocks. Projections indicate potential resistance levels for the S&P 500 at $510-520, indicating potential headwinds despite forecasts of a continued market rally. For reference, the SPY Seasonal Chart is shown below:
Volatility spiked on Monday, with the CBOE Volatility Index (Vix) briefly crossing 16 for the first time in weeks, reflecting market jitters ahead of key inflation readings. This heightened volatility underscores the uncertainty surrounding future market movements.
The impact of last week’s employment data release continues to reverberate through the market this week. While February’s nonfarm payrolls exceeded expectations with a robust gain of 275,000 jobs, concerns arose over the unexpected rise in the unemployment rate to 3.9%. This mixed picture of the labor market has left investors grappling with uncertainties about its underlying health and resilience.
Looking ahead, all eyes are on Tuesday’s consumer price index release, which is expected to have significant implications for interest rate decisions. Meanwhile, the U.S. dollar has seen mixed performance against major currencies, strengthening against some while weakening against others. Fresh data indicating the avoidance of a recession in the fourth quarter has sparked speculation about potential tightening by the Bank of Japan, driving the yen’s recent gains.
In this climate of economic uncertainty, cryptocurrency markets are experiencing a surge, with Bitcoin reaching a record high above $72,000. As markets navigate through mixed signals and anticipate crucial economic reports, volatility is likely to remain a defining feature in the days ahead. Investors are urged to tread cautiously and remain vigilant amidst shifting market dynamics.
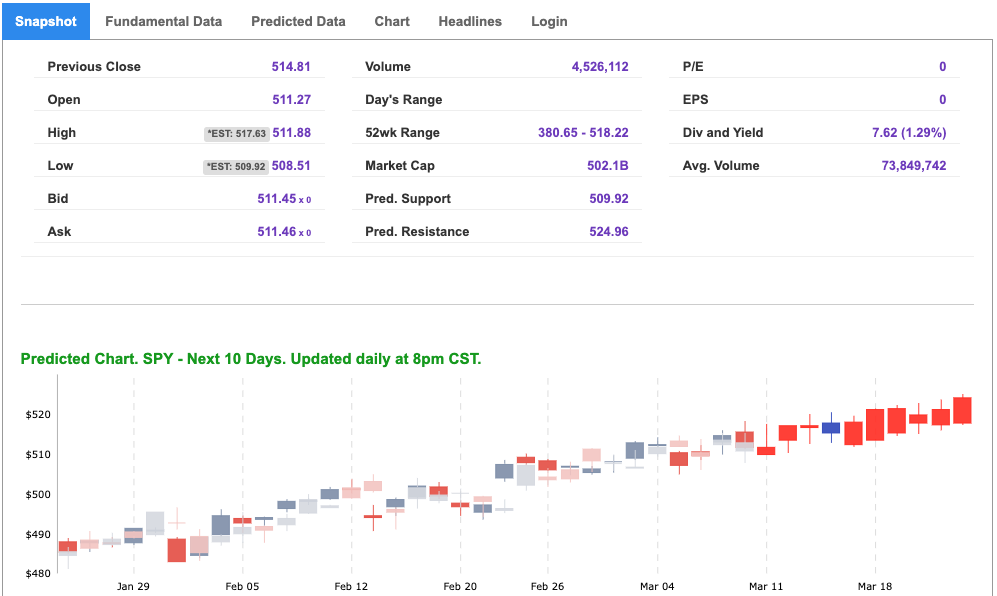
For reference, the S&P 10-Day Forecast is shown below:
Using the “SPY” symbol to analyze the S&P 500 our 10-day prediction window shows a near-term positive outlook. Prediction data is uploaded after the market closes at 6 p.m. CST. Today’s data is based on market signals from the previous trading session.
NEW ROBOINVESTOR SPECIAL:
$100 OFF! Breakthrough, high-tech Artificial Intelligence platform available to Tradespoon’s individual investors:
Click Here – To See Where AI Places My Money
Tuesday Morning Featured Symbol
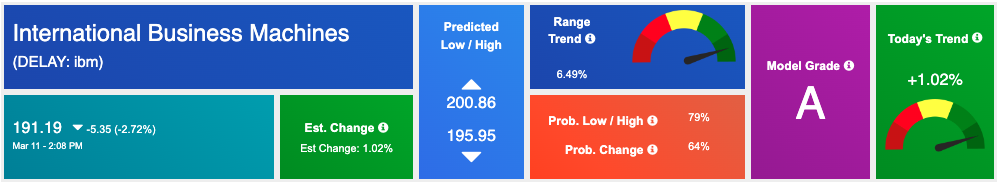
Our featured symbol for Tuesday is International Business Machines (IBM). IBM is showing a steady vector in our Stock Forecast Toolbox’s 10-day forecast.
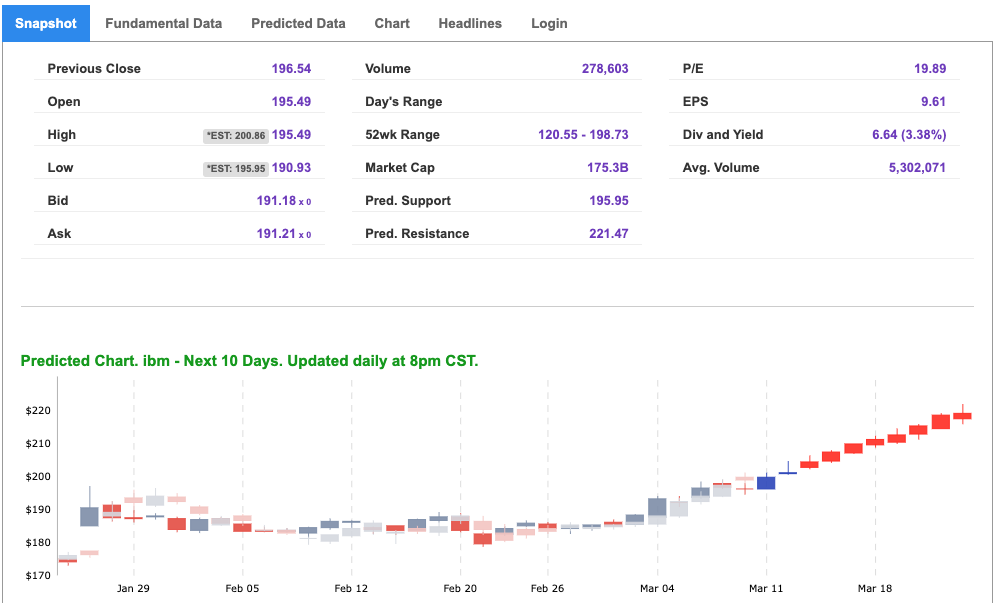
The symbol is trading at $191.19 with a vector of +1.02% at the time of publication.
10-Day Prediction data is uploaded after the market close at 6 p.m., CST. Today’s data is based on market signals from the previous trading session.
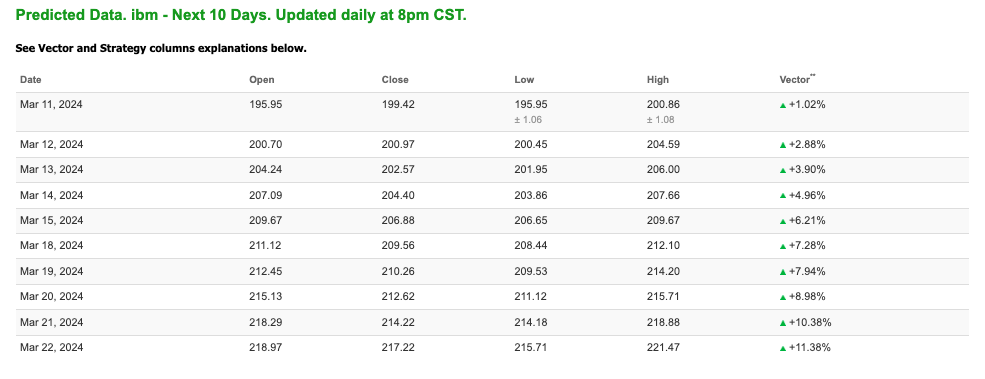
Note: The Vector column calculates the change of the Forecasted Average Price for the next trading session relative to the average of actual prices for the last trading session. The column shows the expected average price movement “Up or Down”, in percent. Trend traders should trade along the predicted direction of the Vector. The higher the value of the Vector the higher its momentum.
*Please note: At the time of publication Vlad Karpel does have a position in the featured symbol, IBM. Our featured symbol is part of your free subscription service. It is not included in any paid Tradespoon subscription service. Vlad Karpel only trades his money in paid subscription services. If you are a paid subscriber, please review your Premium Member Picks, ActiveTrader, or MonthlyTrader recommendations. If you are interested in receiving Vlad’s picks, please click here.
Click Here To Subscribe To Our YouTube Channel So You Don’t Miss Out!
Oil
West Texas Intermediate for Crude Oil delivery (CL.1) is priced at $78.13 per barrel, up 0.15%, at the time of publication.
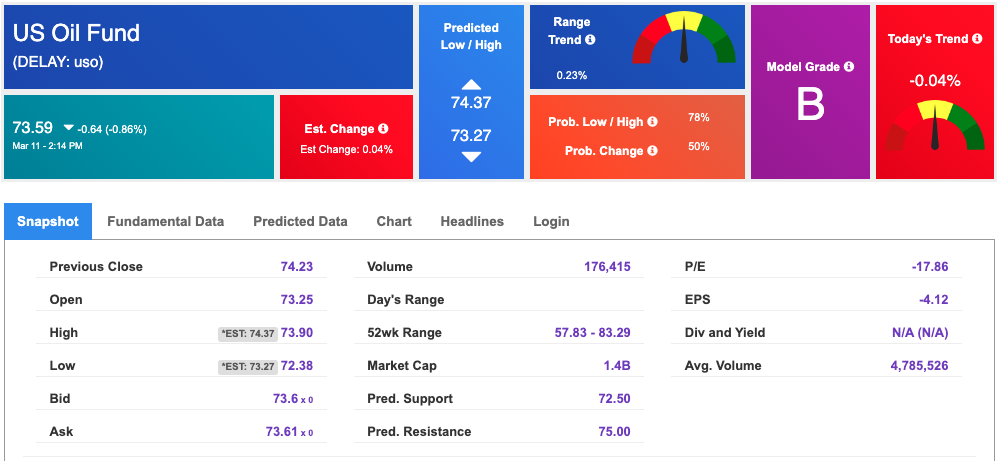
Looking at USO, a crude oil tracker, our 10-day prediction model shows mixed signals. The fund is trading at $73.59 at the time of publication. Prediction data is uploaded after the market close at 6 p.m., CST. Today’s data is based on market signals from the previous trading session.
Gold
The price for the Gold Continuous Contract (GC00) is up 0.20% at $2189.90 at the time of publication.
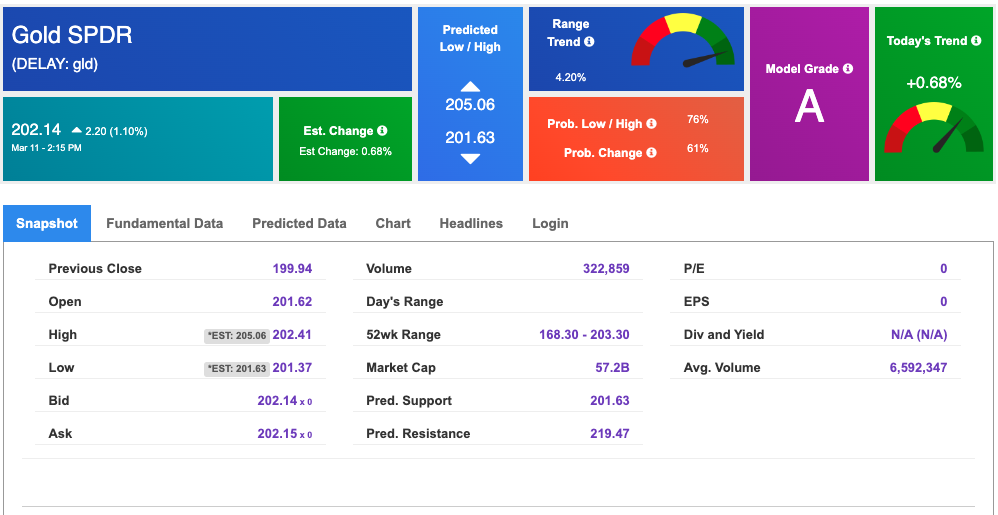
Using SPDR GOLD TRUST (GLD) as a tracker in our Stock Forecast Tool, the 10-day prediction window shows mixed signals. The gold proxy is trading at $202.14 at the time of publication. Vector signals show +0.68% for today. Prediction data is uploaded after the market close at 6 p.m., CST. Today’s data is based on market signals from the previous trading session.
Treasuries
The yield on the 10-year Treasury note is up at 4.098% at the time of publication.
The yield on the 30-year Treasury note is up at 4.263% at the time of publication.
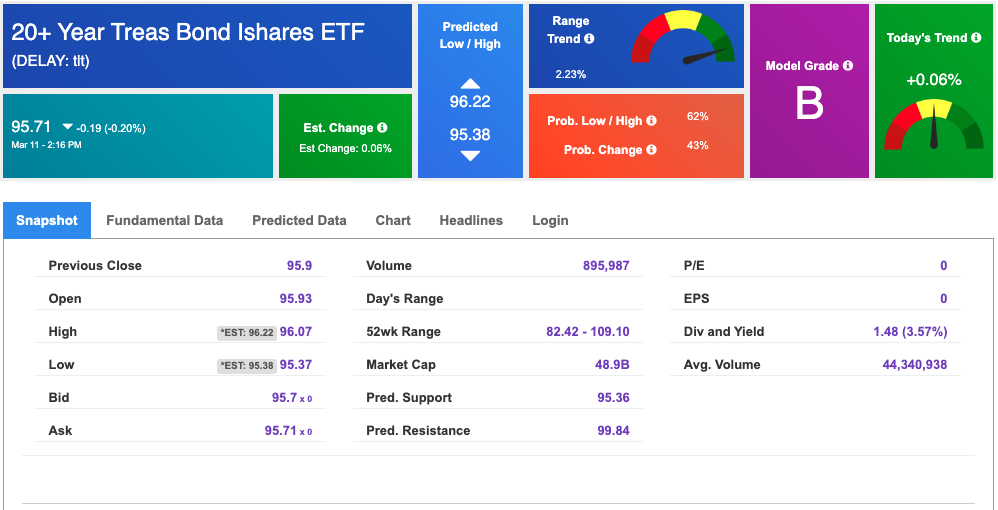
Using the iShares 20+ Year Treasury Bond ETF (TLT) as a proxy for bond prices in our Stock Forecast Tool, we see mixed signals in our 10-day prediction window. Prediction data is uploaded after the market close at 6 p.m., CST. Today’s data is based on market signals from the previous trading session.
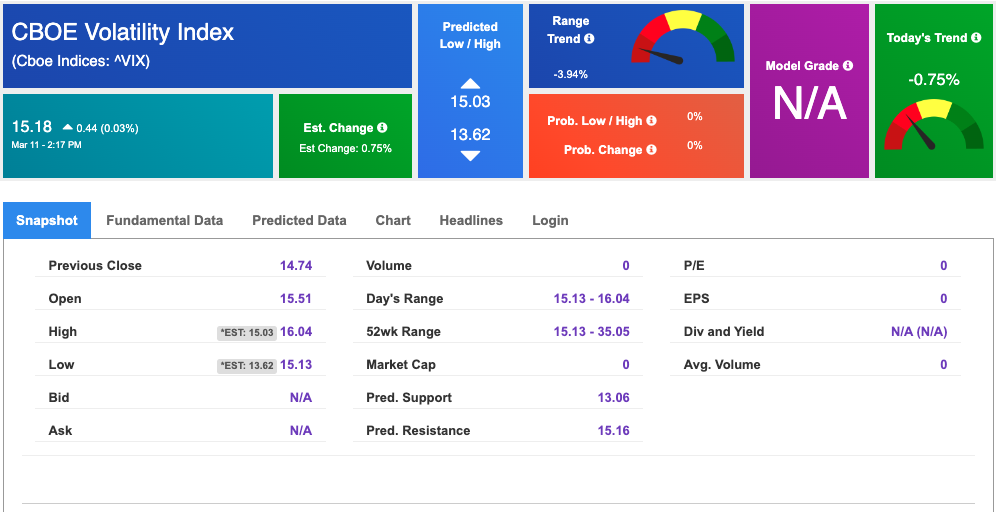
Volatility
The CBOE Volatility Index (^VIX) is priced at $15.18 up 0.03% at the time of publication, and our 10-day prediction window shows mixed signals. Prediction data is uploaded after the market close at 6 p.m., CST. Today’s data is based on market signals from the previous trading session.
NEW ROBOINVESTOR SPECIAL:
$100 OFF! Breakthrough, high-tech Artificial Intelligence platform available to Tradespoon’s individual investors:
Click Here – To See Where AI Places My Money
Original source: https://www.tradespoon.com/blog/brace-for-impact-as-investors-await-inflation-report/