After an exhilarating surge last week, the S&P 500 took a momentary pause as investors embarked on a new trading week, marked by a blend of caution and anticipation. While the broader market experienced a slight dip, the energy sector emerged as a beacon of strength amidst regulatory concerns and economic data expectations.
Monday saw the S&P 500 stepping back, mirroring investors’ cautious stance as they navigated uncertainties. However, within this landscape of subdued activity, the energy sector stood tall, outperforming and infusing the markets with vitality.
Anticipation loomed large ahead of significant economic data releases, propelling Treasury yields higher in anticipation of insights into the housing market’s health. All eyes were on February’s new home sales figures, with forecasts hinting at a potential uptick, providing a silver lining amid the cautious atmosphere.
Reflecting on the prior week’s market drama, the focus had been squarely on the Federal Reserve and its monetary policy deliberations. As expected, the Fed opted for stability, maintaining interest rates unchanged. While this decision fueled a rally that saw major indexes soaring, a subtle decline in the 10-year Treasury yield suggested underlying market reservations.
Looking forward, investors eagerly awaited the unveiling of the core Personal Consumption Expenditure (PCE) index, a key metric post-Fed meeting. With the central bank eyeing potential rate adjustments, scrutiny of inflation data intensified, with implications for future monetary policy decisions. However, the anticipation was tinged with the realization that Good Friday would halt trading activities, prolonging the suspense into the following week.
Meanwhile, across the pond, regulatory challenges weighed on tech giants, casting a shadow over the sector. European Union antitrust investigations targeting industry heavyweights like Apple, Meta Platforms, and Alphabet sent tremors through the market. Shares of these companies saw declines, with Meta Platforms experiencing a 0.9% drop, while Apple and Alphabet registered declines of 1.3%. The regulatory scrutiny underscored the volatility inherent in the tech sector.
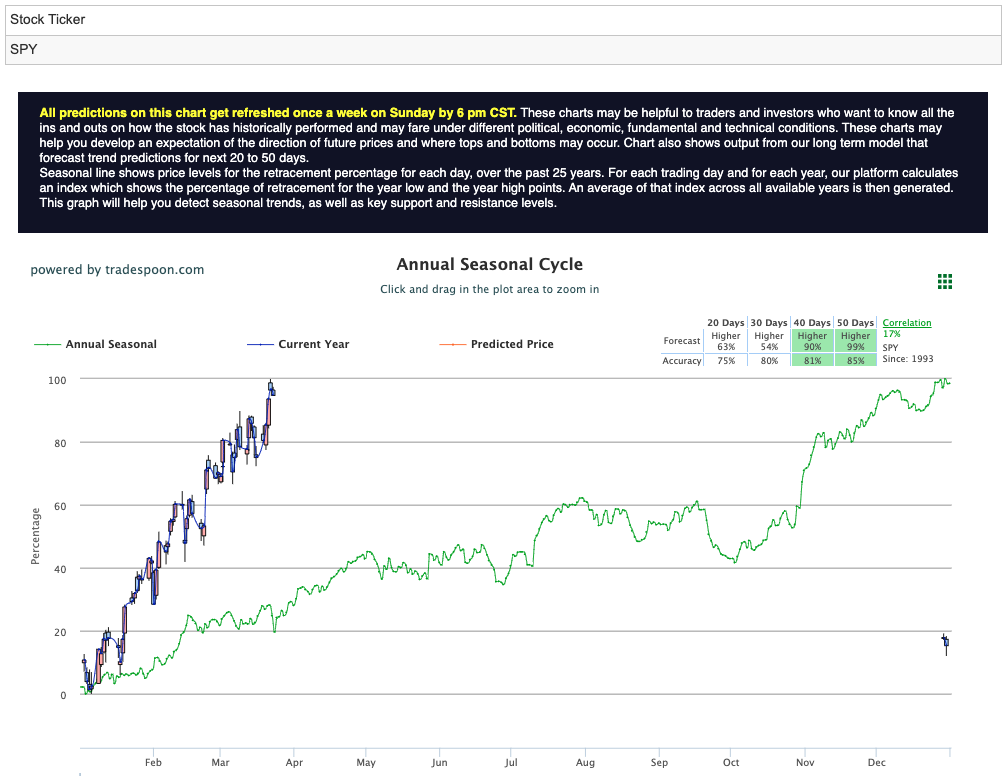
With the current market conditions in mind, caution intertwined with resilience as investors navigated through economic data releases and regulatory hurdles. While uncertainties abound, the resilience of the energy sector and the broader market’s ability to weather headwinds offer a glimpse into the resilience of the financial ecosystem. Despite recent optimism, market analysts are urging caution, emphasizing the importance of short-term support levels between 480 and 490 on the S&P 500 ETF (SPY). This sense of caution underscores investors’ apprehension in the face of increasing inflationary pressures. For reference, the SPY Seasonal Chart is shown below:
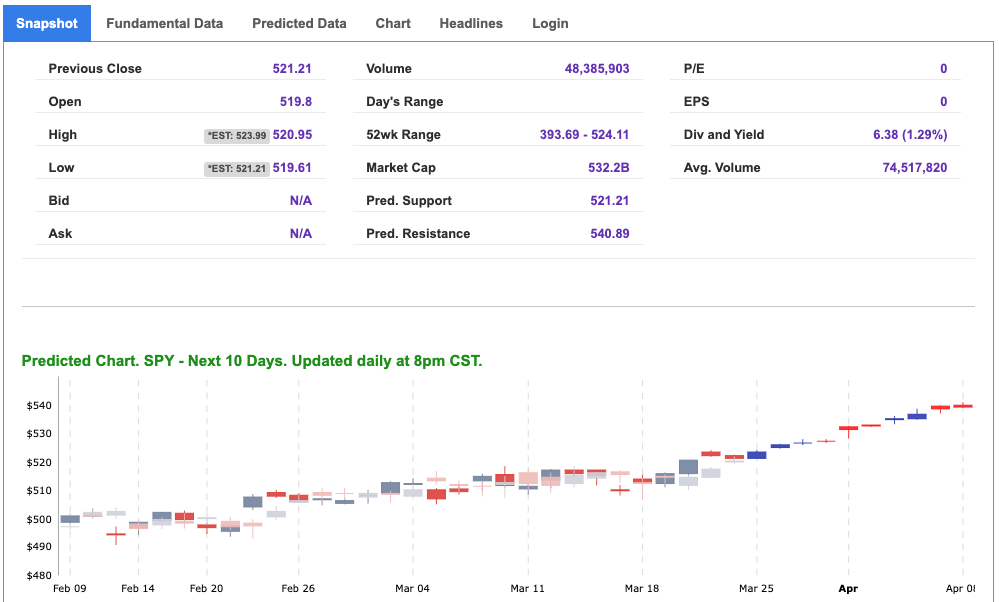
For reference, the S&P 10-Day Forecast is shown below:
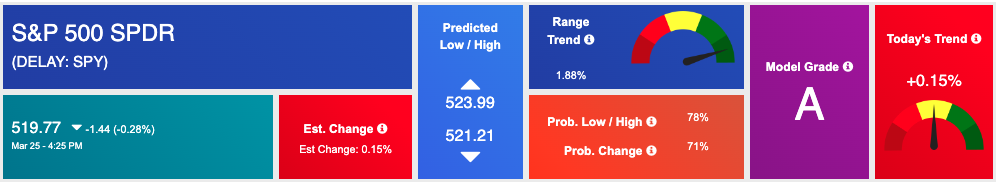
Using the “SPY” symbol to analyze the S&P 500 our 10-day prediction window shows a near-term positive outlook. Prediction data is uploaded after the market closes at 6 p.m. CST. Today’s data is based on market signals from the previous trading session.
NEW ROBOINVESTOR SPECIAL:
$100 OFF! Breakthrough, high-tech Artificial Intelligence platform available to Tradespoon’s individual investors:
Click Here – To See Where AI Places My Money
Tuesday Morning Featured Symbol
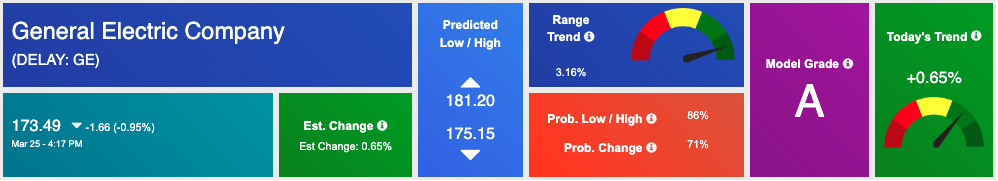
Our featured symbol for Tuesday is General Electric Company (GE). GE is showing a steady vector in our Stock Forecast Toolbox’s 10-day forecast.
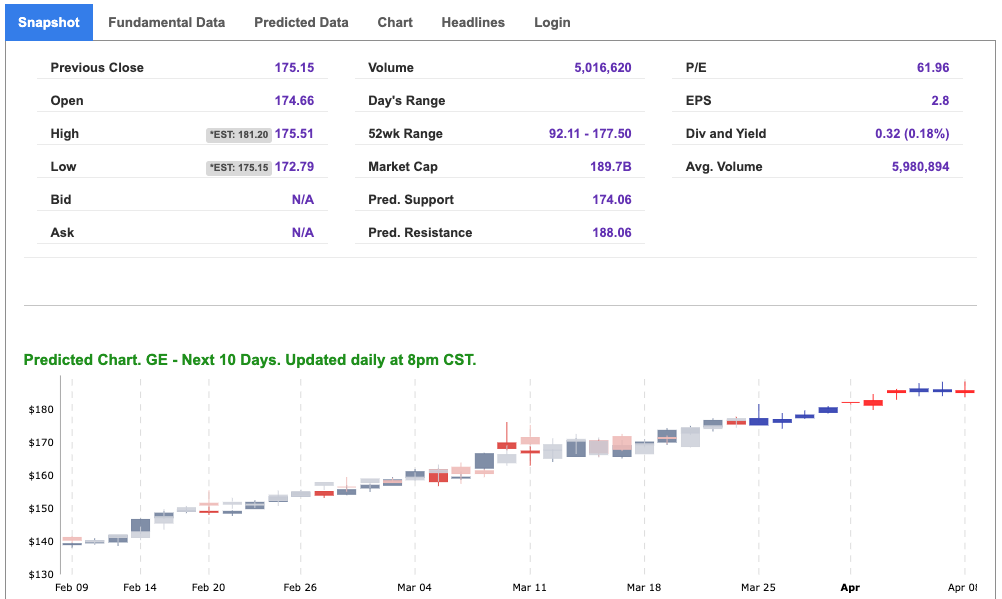
The symbol is trading at $173.49 with a vector of +0.65% at the time of publication.
10-Day Prediction data is uploaded after the market close at 6 p.m., CST. Today’s data is based on market signals from the previous trading session.
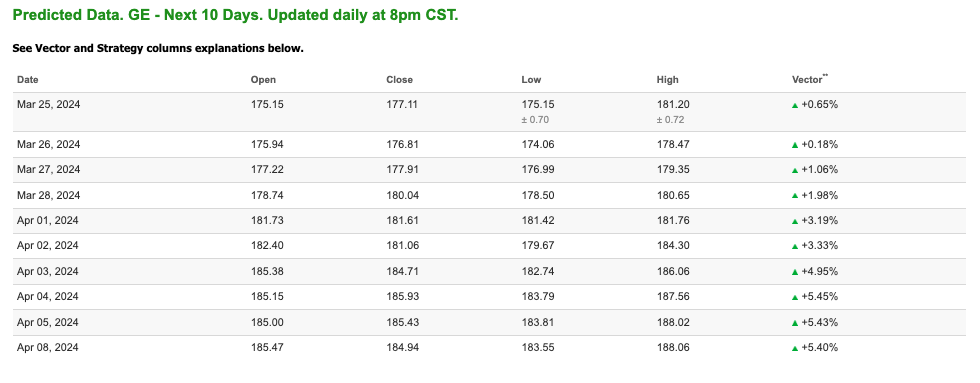
Note: The Vector column calculates the change of the Forecasted Average Price for the next trading session relative to the average of actual prices for the last trading session. The column shows the expected average price movement “Up or Down”, in percent. Trend traders should trade along the predicted direction of the Vector. The higher the value of the Vector the higher its momentum.
*Please note: At the time of publication Vlad Karpel does have a position in the featured symbol, GE. Our featured symbol is part of your free subscription service. It is not included in any paid Tradespoon subscription service. Vlad Karpel only trades his money in paid subscription services. If you are a paid subscriber, please review your Premium Member Picks, ActiveTrader, or MonthlyTrader recommendations. If you are interested in receiving Vlad’s picks, please click here.
Click Here To Subscribe To Our YouTube Channel So You Don’t Miss Out!
Oil
West Texas Intermediate for Crude Oil delivery (CL.1) is priced at $81.99 per barrel, up 1.69%, at the time of publication.
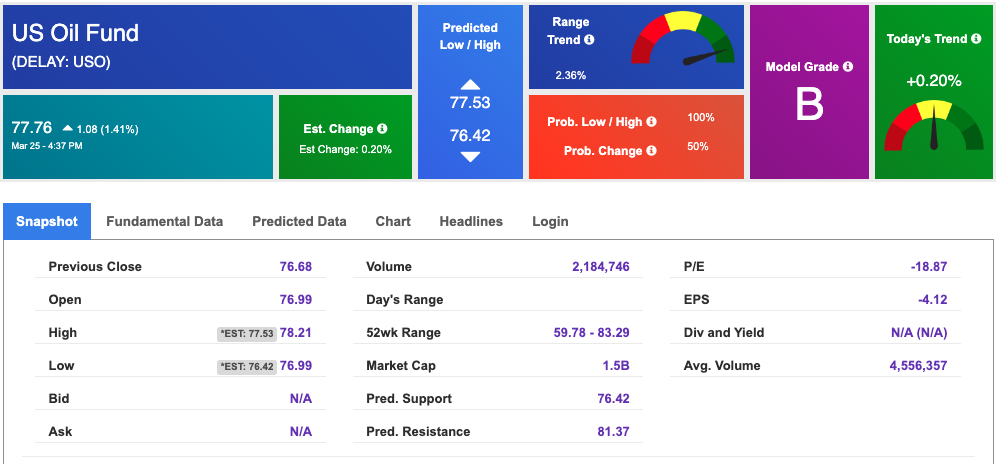
Looking at USO, a crude oil tracker, our 10-day prediction model shows mixed signals. The fund is trading at $77.76 at the time of publication. Prediction data is uploaded after the market close at 6 p.m., CST. Today’s data is based on market signals from the previous trading session.
Gold
The price for the Gold Continuous Contract (GC00) is up 0.60% at $2173.00 at the time of publication.
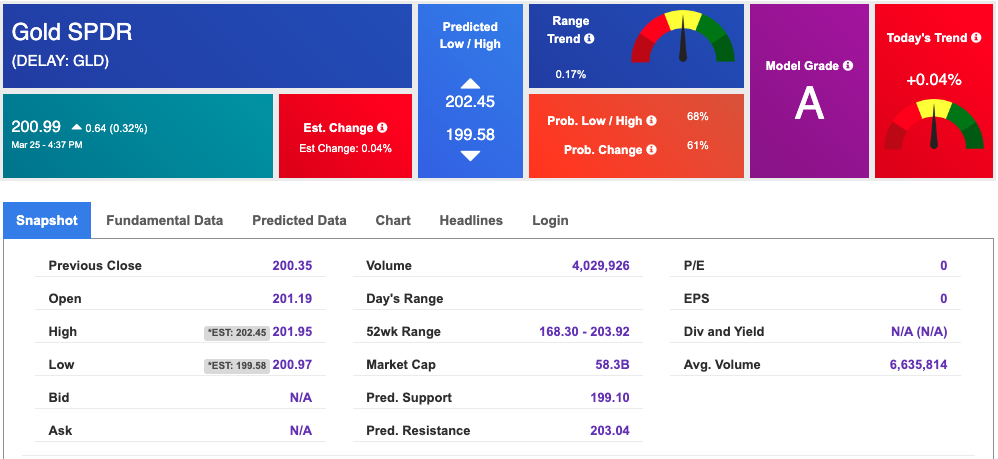
Using SPDR GOLD TRUST (GLD) as a tracker in our Stock Forecast Tool, the 10-day prediction window shows mixed signals. The gold proxy is trading at $200.99 at the time of publication. Vector signals show -0.04% for today. Prediction data is uploaded after the market close at 6 p.m., CST. Today’s data is based on market signals from the previous trading session.
Treasuries
The yield on the 10-year Treasury note is up at 4.246% at the time of publication.
The yield on the 30-year Treasury note is up at 4.416% at the time of publication.
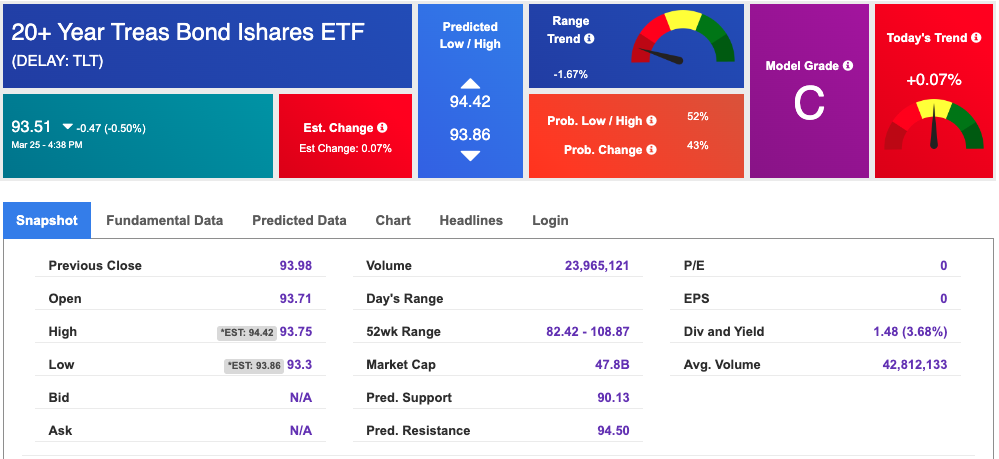
Using the iShares 20+ Year Treasury Bond ETF (TLT) as a proxy for bond prices in our Stock Forecast Tool, we see mixed signals in our 10-day prediction window. Prediction data is uploaded after the market close at 6 p.m., CST. Today’s data is based on market signals from the previous trading session.
Volatility
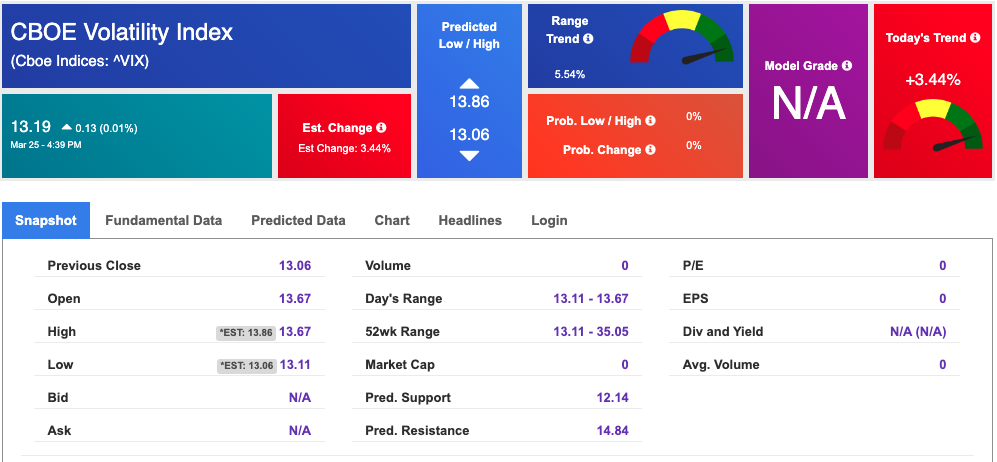
The CBOE Volatility Index (^VIX) is priced at $13.19 down 3.44% at the time of publication, and our 10-day prediction window shows mixed signals. Prediction data is uploaded after the market close at 6 p.m., CST. Today’s data is based on market signals from the previous trading session.
NEW ROBOINVESTOR SPECIAL:
$100 OFF! Breakthrough, high-tech Artificial Intelligence platform available to Tradespoon’s individual investors:
Click Here – To See Where AI Places My Money
Original source: https://www.tradespoon.com/blog/sp-500-retreats-energy-sector-shines-amidst-regulatory-headwinds/